The latest Consumer Price Index (CPI) reported that we have yet to tame inflation. The CPI showed a 9.1% increase from the prior year, the largest increase since 1981. Also, the month-to-month change in CPI was reported as higher than expectations at +1.3%. The increase in the CPI was fueled (no pun intended) by sustained increases in energy, specifically gasoline, shelter, and food.
It is worth noting, however, that these CPI data points are backward-looking. We have all witnessed the rise in these prices and for the most part, have absorbed them. The focus now is where do prices go? There is some data suggesting that we may have reached peak inflation in many commodities and lower prices are coming. Traders and analysts say that some of the declines in commodity prices can be traced to the retreat of investors who piled into markets for fuel, metals, and crops to hedge against inflation. JPMorgan Chase commodity strategist Tracey Allen said about $15 billion moved out of commodity futures markets during the week ended June 24. It was the fourth straight week of outflows and brought to about $125 billion the total that has been pulled from commodities this year, a seasonal record that tops even the exodus in 2020 as economies closed.
The yield curve of certain maturities of Treasury Bonds has recently had some inversions. An inversion is when shorter-term maturities have a current yield that is higher than longer-dated maturities. While this gauge has historically been used as a predictor of a coming recession, the severity or duration of the recession is not known. The inversion implies investors are betting that inflation will be lower in the future than it is now. The federal reserve is currently aggressively raising short-term interest rates with the expectation that this will help tamp down inflation.
So What Now?
Rising interest rates, high inflation, and extreme geopolitical tensions are all contributing factors to the poor performance of public markets, both equities, and fixed income. But long-term investments cannot be made with a singular focus on what is happening now. Being in the current economic and political environment can lead us to “bubble” thinking. What we are in now is what will be going forward. There is a war raging in Europe that has created severe disruptions in commodities, currencies, and most importantly lives.
Will these conditions persist as they are 12 months from now? Will the US Federal Reserve be able to tame inflation through aggressive rate hikes? Can corporations pass along their higher input costs to us as consumers? Will commodity prices decline as supply chain disruptions ease?
What History Tells Us
While past performance is never a guarantee of future results, focusing on long-term investing while ignoring short-term volatility gives us the strength to stay the course. We can rely in some part on historical performance and correlations to help.
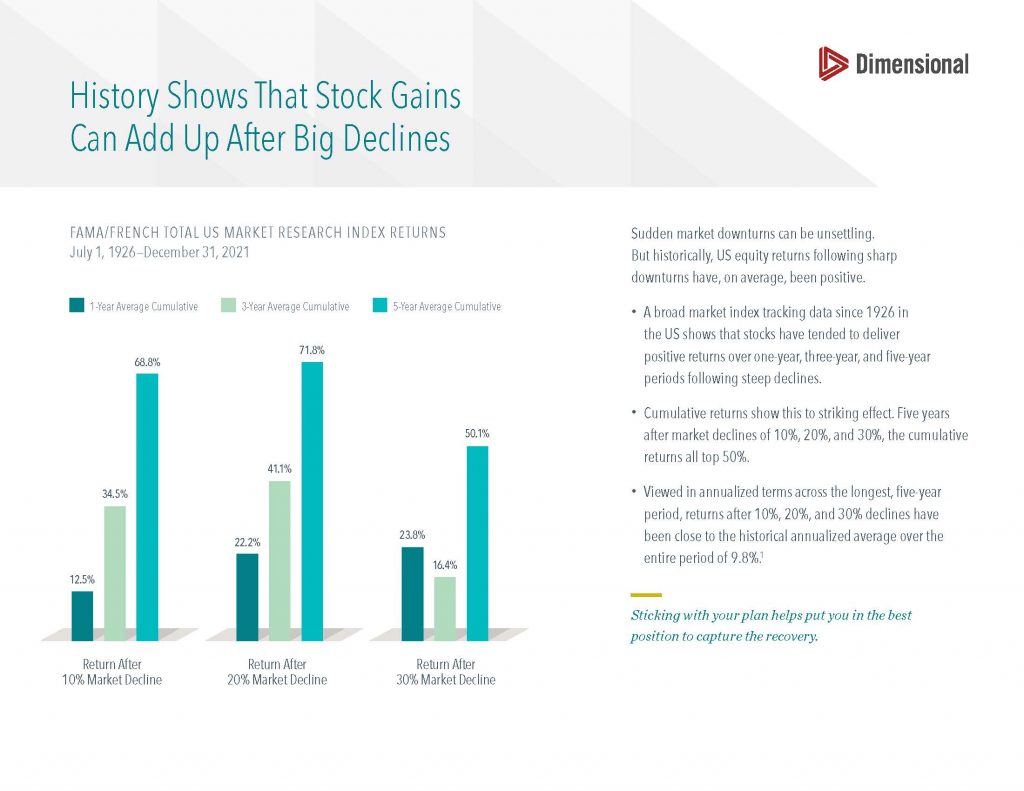
According to a chart provided by Dimensional Fund Advisors, U.S. equity returns have on average been positive following sharp downturns as experienced in 2022. Since 1926, stocks have tended to deliver positive returns over one-, three-, and five-year periods following steep declines. Five years after market declines of 10%, 20%, and 30%, the cumulative returns all top 50%. Viewed in annualized terms across the five-year period, these returns after declines have been close to the historical annualized average of 9.8%.

Investor expectations are re-priced during market turmoil and once we achieve a new base level based on current conditions, future returns may outperform.
As we navigate through these volatile times, we continue to focus on meeting short-term needs and simultaneously positioning for long-term growth.
- The average annualized returns for the five-year period after 10% declines were 9.54%; after 20% declines, 9.66%; and after 30% declines, 7.18%.


